
BLOG: ✨ StarWind SAN & NAS over Fibre Channel: MDRAID vs Graid Technology

(StarWind Software, Volodymyr Khrystenko, July 20, 2022)
Introduction
The new build of StarWind SAN & NAS has just gotten released and it will bring us the long-awaited FC (Fibre Channel) ecosystem support. StarWind SAN & NAS has been designed to give a new life to your existing hardware. Installed either on top of the hypervisor of your choice or bare-metal, it turns your server into a fast shared storage pool that can be accessed over iSCSI, SMB, or NFS. And in the new build, via FC as well. It uses the same SDS engine as StarWind vSAN which means high performance and also adds new features such as ZFS support to build the utmost resilient storage system using the commodity hardware.
This was a great chance to test how fast StarWind SAN & NAS can go using FC. Folks from StorageReview were kind to provide us with the testing infrastructure where we performed the benchmark. Thanks, StorageReview team once again!
Testing scope
We have tested the performance of shared storage presented from a dedicated storage node full of NVMe drives and StarWind SAN & NAS on top over FC to client nodes. We have decided to include only good old FCP (FCP – Fibre Channel Protocol) benchmark results in this article since the results of NVMe-FC were at the same level (on certain patterns even lower than FCP). To collect NVMe drives into a redundant storage array, we have used MDRAID and Graid tools and tested them separately. MDRAID is a Linux software RAID that is present as part of StarWind SAN & NAS and serves to collect drives into a redundant array. Graid is an extremely fast NVMe/NVMeoF RAID card, designed to deliver the full potential of PCIe Gen4 systems.
It is worth mentioning that Graid SupremeRAID is the only NVMe RAID card as of now capable of delivering the highest SSD performance possible that removes performance bottlenecks altogether. What is the difference, you may wonder? Well, Graid SupremeRAID SR-1010 is based on an NVIDIA A2000 GPU. In most characteristics, that doesn’t make this solution anything special, but when it comes to the NVMe RAID bottlenecks, the GPU can give a head start to lots of alternatives. In particular, the SupremeRAID is capable of processing all the I/O operations directly, and we don’t need to tell you just how much this frees up the CPU resources. Standard RAID cards are simply no match for the computing potential of the GPU card. Even though the Graid solution is a software RAID, the NVIDIA GPU card is essential to a lot of benefits that Graid has to offer. Additionally, thanks to the specifics of Graid software architecture, data can flow directly from the CPU and straight to the storage, passing by the Graid card.
Traditionally, NVIDIA cards serve various purposes. They are in demand for use in gaming, video acceleration, cryptocurrency mining, and professional working tools such as VDI. Moreover, NVIDIA also produces GPUs for vehicles. Now? NVIDIA hardware powers storage appliances. This novelty embarks nothing less but a breakthrough in utilizing the computing potential of the GPU in a whole new field.
Testing bed
Here is the list of the hardware and software used in our benchmark.
Storage node:
Hardwaresw-sannas-01Dell PowerEdge R750CPUIntel(R) Xeon(R) Platinum 8380 CPU @ 2.30GHzSockets2Cores/Threads80/160RAM1024GbStorage8x (NVMe) – PBlaze6 6926 12.8TBGRAIDSupremeRAID SR-1010HBAs4x Marvell® QLogic® 2772 Series Enhanced 32GFC Fibre Channel AdaptersSoftwareStarWind SAN&NASVersion 1.0.2 (build 2175 – FC)
Client nodes:
Hardwarewin-cli-{01..04}PowerEdge R740xdCPUIntel® Xeon® Gold 6130 Processor 2.10GHzSockets2Cores/Threads32/64RAM256GbHBAs1x Marvell® QLogic® 2772 Series Enhanced 32GFC Fibre Channel AdaptersSoftwareOSWindows Server 2019 Standard Edition
Testbed architecture overview:
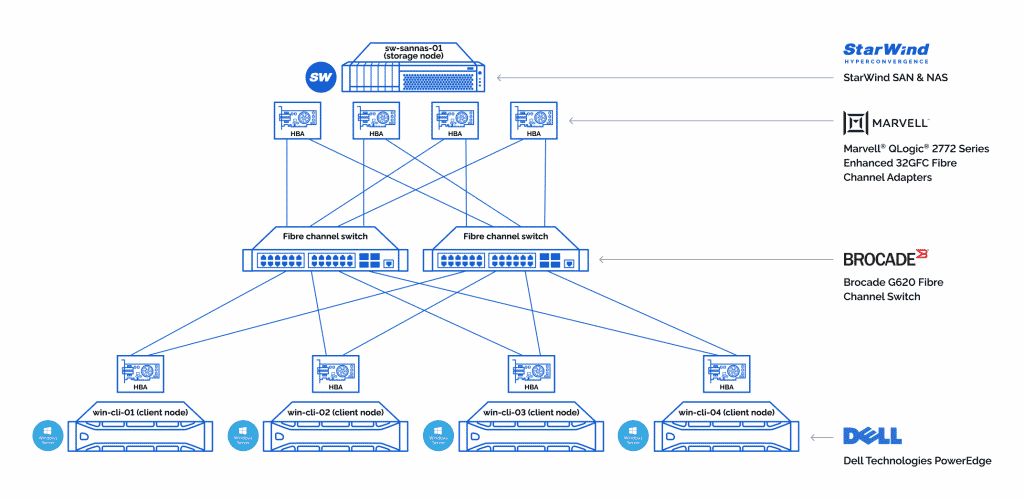
The communication between storage nodes and client nodes has been carried out over 32GFC Fibre Channel fabric. The storage node had 4x Marvell® QLogic® 2772 Series Enhanced 32GFC Fibre Channel Adapters while each client node had one. The storage and client nodes were connected using two Brocade G620 Fibre Channel Switches to ensure resilience.
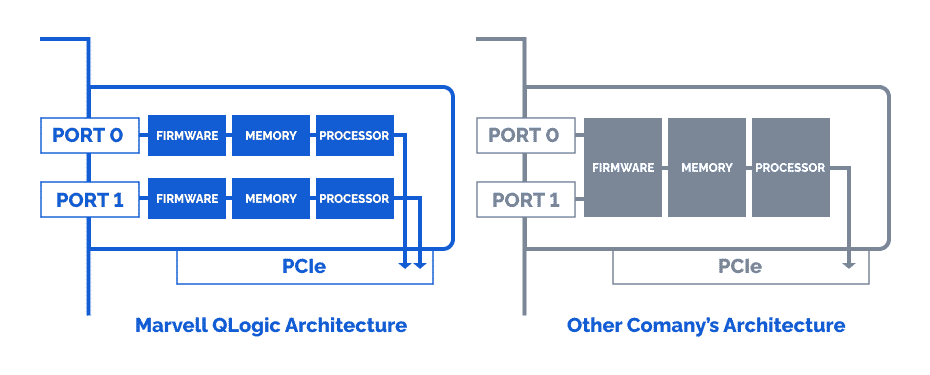
The interesting thing behind Marvell Qlogic 2772 Fibre Channel adapters is that the ports on it are independently resourced which gives an additional layer of resilience. The complete port-level isolation across the FC controller architecture prevents errors and firmware crashes from propagating across all ports. Find out more about Marvell Qlogic 2772 Fibre Channel adapters in terms of high availability and reliability.
Storage connection diagram:
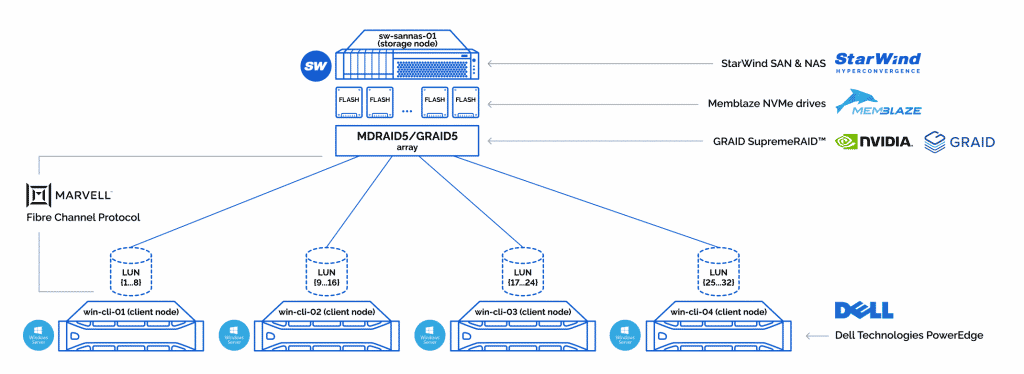
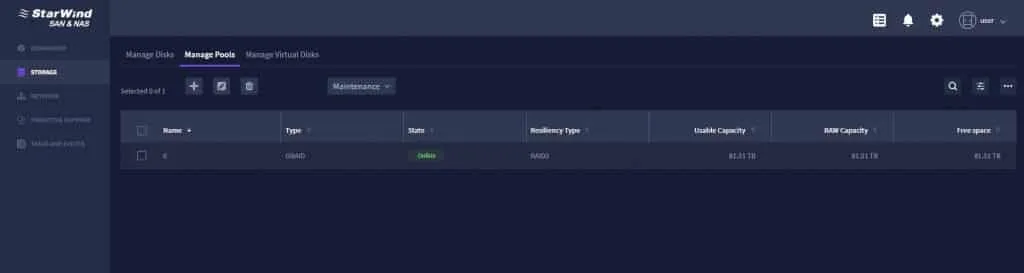
We have collected 8 NVMe drives on the storage node in the RAID5 array:
First, using MDRAID:

And then, with Graid correspondingly:
Once the RAID arrays were ready, we sliced them into 32 LUNs, 1TB each. These were distributed by 8 LUNs per client node. This was done since 1 LUN has a performance limitation and we wanted to squeeze the max out of our storage.
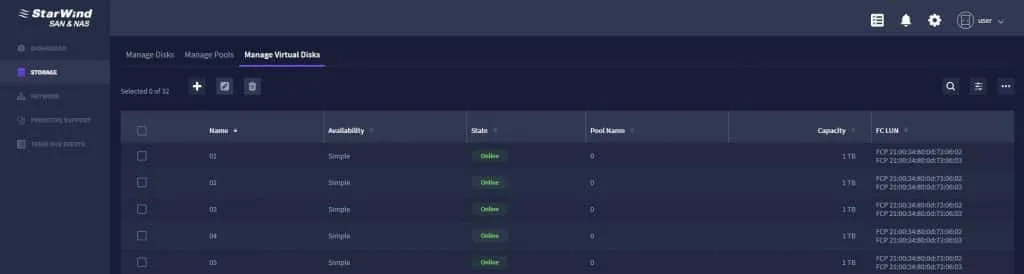
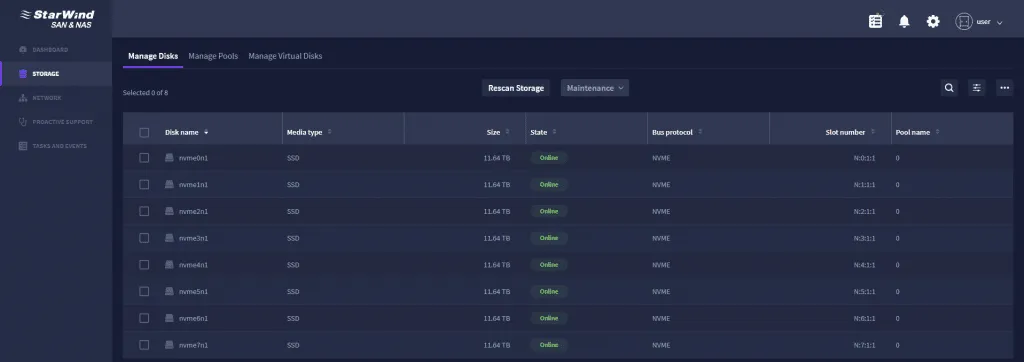
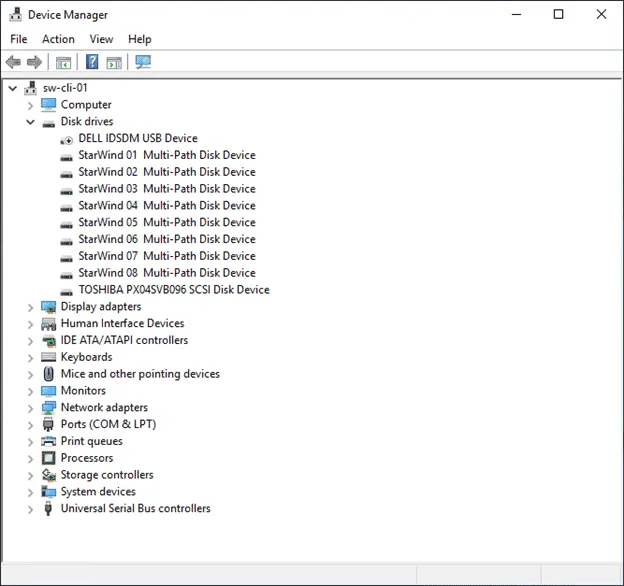
This is the example of 8 LUNs connected on one client node:
Testing Methodology
The benchmark was held using the fio utility. fio is a cross-platform, industry-standard benchmark tool used to test local storage as well as shared.
Testing patterns:
- 4k random read;
- 4k random write;
- 4k random read/write 70/30;
- 64K random read;
- 64K random write;
- 1M sequential read;
- 1M sequential write.
Test duration:
- Single test duration = 600 seconds;
- Before starting the write benchmark, storage has been first warmed ups for 2 hours;
Testing stages
- Testing single NVMe drive performance to get reference numbers;
- Testing MDRAID and Graid RAID5 array performance locally;
- Running benchmark remotely from client nodes.
1. Testing single NVMe drive performance:

Talking about these NVMe SSDs, an interesting thing is that they support 10W~35W flexible power management and 25W power mode by default. Basically, Memblaze’s NVMe drives to increase performance on sequential writes by consuming more power, which gives a flexible way to tune drive performance as per specific workload.
We have received the optimal (speed/latency) performance patterns of a single NVMe drive under the following number of jobs and IO depth values:
1 NVMe PBlaze6 D6926 Series 12.8TBPatternNumjobsIOdepthIOPsMiB\sLatency (ms)4k random read1632151400059140,3374k random write4453700020960,02964k random read4810300064670,30864k random write224200026260,0941M read14657665760,6071M write12539353930,370
Before running the actual tests, we have determined the time needed to warm up the NVMe drives to Steady State:

From the graph, it was visible that the NVMe drives should be warmed up for around 2 hours.
2. Testing MD and Graid RAID arrays performance locally:
Fewer words, more numbers. Heading to MDRAID and Graid local performance tests.
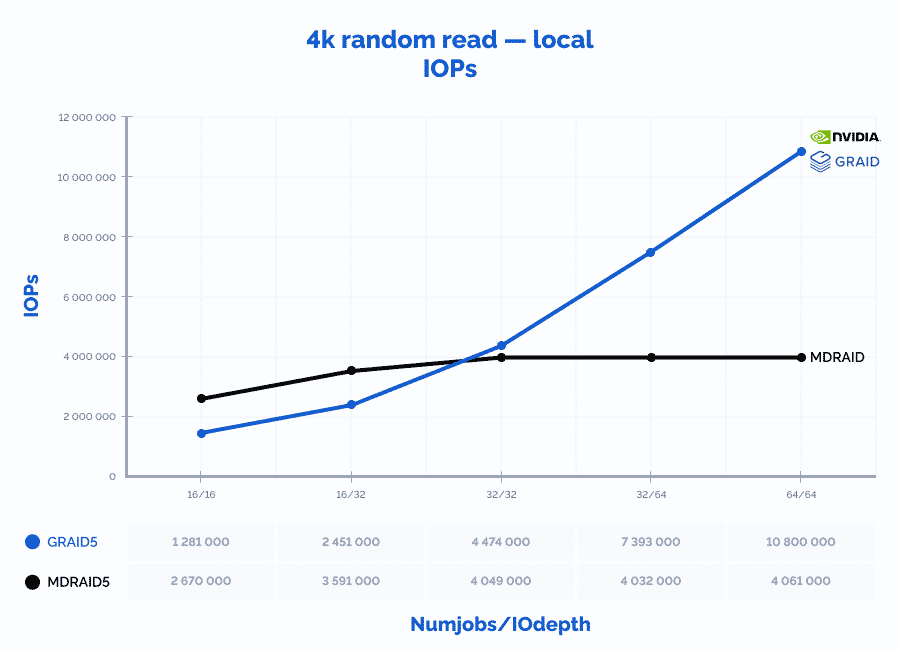
4k random read:
Table result:
MDRAID5GRAID5ComparisonPatternNumjobsIOdepthIOPsMiB\sLatency (ms)CPU usageIOPsMiB\sLatency (ms)CPU usageIOPsMiB\sLatency (ms)CPU usage4k random read16162670000104300,0957%128100050040,1983%48%48%208%46%4k random read16323591000140270,14110%245100095740,2076%68%68%147%60%4k random read32324049000158160,25020%4474000174770,22710%110%110%91%50%4k random read32644032000157500,50430%7393000288790,27516%183%183%55%53%4k random read64644061000158630,99840%10800000421880,37725%266%266%38%63%
Graphs:

4k random write:
Table result:
MDRAID5GRAID5ComparisonPatternNumjobsIOdepthIOPsMiB\sLatency (ms)
.jpg)
.jpg)